

By Tom Capper, from Moz Blog – http://bit.ly/1ohBqXg
Customer loyalty is one of the strongest assets a business can have, and one that any can aim to improve. However, improvement requires iteration and testing, and iteration and testing require measurement.
Traditionally, customer loyalty has been measured using customer surveys. The Net Promoter Score, for example, is based on the question (on a scale of one to ten) “How likely is it that you would recommend our company/product/service to a friend or colleague?”. Regularly monitoring metrics like this with any accuracy is going to get expensive (and/or annoying to customers), and is never going to be hugely meaningful, as advocacy is only one dimension of customer loyalty. Even with a wider range of questions, there’s also some risk that you end up tracking what your customers claim about their loyalty rather than their actual loyalty, although you might expect the two to be strongly correlated.
Common mistakes
Google Analytics and other similar platforms collect data that could give you more meaningful metrics for free. However, they don’t always make them completely obvious – before writing this post, I checked to be sure there weren’t any very similar ones already published, and I found some fairly dubious reoccurring recommendations. The most common of these was using % of return visitors as a sole or primary metric for customer loyalty. If the percentage of visitors to your site who are return visitors drops, there are plenty of reasons that could be behind that besides a drop in loyalty—a large number of new visitors from a successful marketing campaign, for example. Similarly, if the absolute number of return visitors rises, this could be as easily caused by an increase in general traffic levels as by an increase in the loyalty of existing customers.
Visitor frequency is another easily misinterpreted metric;
infrequent visits do not always indicate a lack of loyalty. If you were a loyal Mercedes customer, and never bought any car that wasn’t a new Mercedes, you wouldn’t necessarily visit their website on a weekly basis, and someone who did wouldn’t necessarily be a more loyal customer than you.
The metrics
Rather than starting with the metrics Google Analytics shows us and deciding what they mean about customer loyalty (or anything else), a better approach is to decide what metrics you want, then deciding how you can replicate them in Google Analytics.
To measure the various dimensions of (online) customer loyalty well, I felt the following metrics would make the most sense:
- Proportion of visitors who want to hear more
- Proportion of visitors who advocate
- Proportion of visitors who return
- Proportion of macro-converters who convert again
Note that a couple of these may not be what they initially seem. If your registration process contains an awkwardly worded checkbox for email signup, for example, it’s not a good measure of whether people want to hear more. Secondly, “proportion of visitors who return” is not the same as “proportion of visitors who are return visitors.”
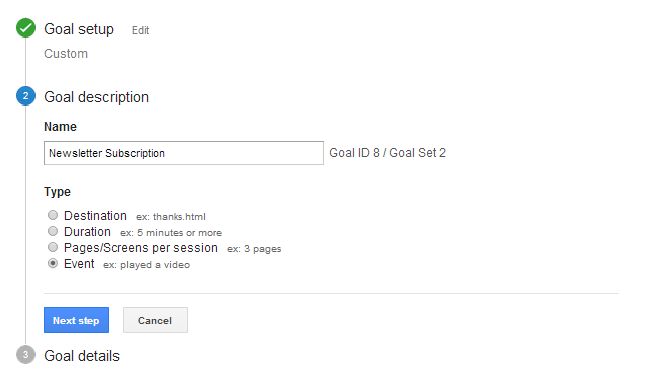
1. Proportion of visitors who want to hear more
This is probably the simplest of the above metrics, especially if you’re already tracking newsletter signups as a micro-conversion. If you’re not, you probably should be, so see Google’s guidelines for event tracking using the analytics.js tracking snippet or Google Tag Manager, and set your new event as a goal in Google Analytics.
2. Proportion of visitors who advocate
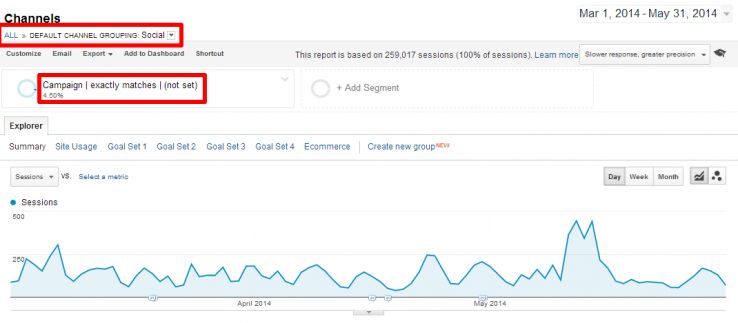
It’s never possible to track every public or private recommendation, but there are two main ways that customer advocacy can be measured in Google Analytics: social referrals and social interactions. Social referrals may be polluted as a customer loyalty metric by existing campaigns, but these can be segmented out if properly tracked, leaving the social acquisition channel measuring only organic referrals.
Social interactions can also be tracked in Google Analytics, although surprisingly, with the exception of Google+, tracking them does require additional code on your site. Again, this is probably worth tracking anyway, so if you aren’t already doing so, see Google’s guidelines for analytics.js tracking snippets, or this excellent post for Google Tag Manager analytics implementations.
3. Proportion of visitors who return
As mentioned above, this isn’t the same as the proportion of visitors who are return visitors. Fortunately, Google Analytics does give us a feature to measure this.
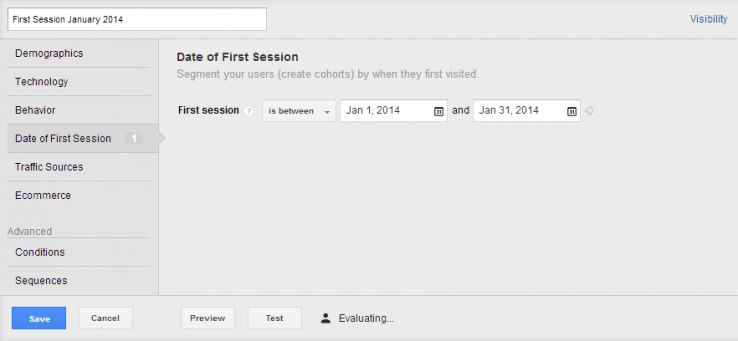
Even though date of first session isn’t available as a dimension in reports, it can be used as a criteria for custom segments. This allows us to start building a data set for how many visitors who made their first visit in a given period have returned since.
There are a couple of caveats. First, we need to pick a sensible time period based on our frequency and recency data. Second, this data obviously takes a while to produce; I can’t tell how many of this month’s new visitors will make further visits at some point in the future.
In Distilled’s case, I chose 3 months as a sensible period within which I would expect the vast majority of loyal customers to visit the site at least once. Unfortunately, due to the 90-day limit on time periods for this segment, this required adding together the totals for two shorter periods. I was then able to compare the number of new visitors in each month with how many of those new visitors showed up again in the subsequent 3 months:
As ever with data analysis, the headline figure doesn’t tell the story. Instead, it’s something we should seek to explain. Looking at the above graph, it would be easy to conclude “Distilled’s customer loyalty has bombed recently; they suck.” However, the fluctuation in the above graph is mostly due to the enormous amount of organic traffic that’s been generated by Hannah‘s excellent blog post 4 Types of Content Every Site Needs.
Although many new visitors who discovered the Distilled site through this blog post have returned since, the return rate is unsurprisingly lower than some of the most business-orientated pages on the site. This isn’t a bad thing—it’s what you’d expect from top-of-funnel content like blog posts—but it’s a good example of why it’s worth keeping an eye out for this sort of thing if you want to analyse these metrics. If I wanted to dig a little deeper, I might start by segmenting this data to get a more controlled view of how new visitors are reacting to Distilled’s site over time.
4. Proportion of macro-converters who convert again
While a standard Google Analytics implementation does allow you to view how many users have made multiple purchases, it doesn’t allow you to see how these fell across their sessions. Similarly, if you can see how many users have had two sessions and two goal conversions, but you can’t see whether those conversions were in different visits, it’s entirely possible that some had one accidental visit that bounced, and one visit with two different conversions (note that you cannot perform the same conversion twice in one session).
It would be possible to create custom dimensions for first (and/or second, third, etc.) purchase dates using internal data, but this is a complex and site-specific implementation. Unfortunately, for the time being, I know of no good way of documenting user conversion patterns over multiple sessions using only Google Analytics, despite the fact that it collects all the data required to do this.
Contribute
These are only my favourite customer loyalty metrics. If you have any that you’re already tracking or are unsure how to track, please explain in the comments below.